How Does Prompt Caching Actually Cut Your Bill?
Prompt caching stores the model’s computed state, not your text — so it saves money and latency but never a single token of window space. What a breakpoint really marks, why cache entries nest instead of slicing, and the byte-level changes that silently drop your hit rate to zero.
The previous post in this series — What Fills Your Context Window, and Why Does the Answer Run Out of Room? — worked out what actually occupies a model's context window, and mentioned in passing that a cached prefix still counts against it, the same as anything else you send. This post goes deep on that aside: what caching actually stores, what a hit really buys you, and what silently breaks it. It rebuilds the one fact everything below depends on, so nothing here assumes you read that post first.
Here's the fact. Whatever separate fields you send — a system prompt, tool definitions, a list of messages — none of that survives contact with the model as separate fields. It all gets flattened into one linear sequence of tokens before the model runs, with special marker tokens standing in for boundaries you never see. On the Claude API, that sequence always renders in one fixed order: tools, then system, then messages. Because it's one flat sequence, any earlier stretch of it — starting at the very first token and running up to some point — is a well-defined slice of the whole prompt. Call that slice a prefix. Nearly everything below is really one question asked over and over: which prefix, if any, has the server already seen before?
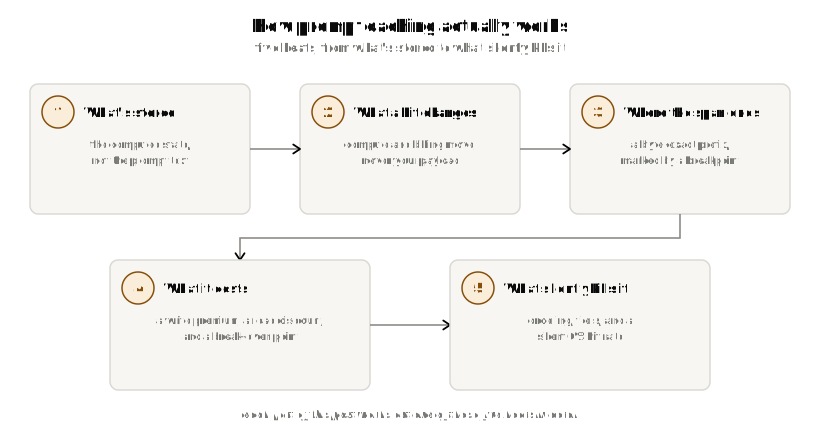
This post answers that in five steps. First, what is stored — not your text, the model's already-computed internal state. Second, what a hit changes — compute and the bill, never your payload and never the window. Third, where the span ends — a byte-exact prefix, and what a breakpoint actually marks. Fourth, what it costs — a write premium, a read discount, and the point where caching starts paying for itself. And fifth, what silently kills it — an ordering mistake, a tier you didn't know existed, and a hit rate of zero with no error anywhere in sight.
What is actually cached
Start with the word itself, because it's doing a lot of misleading work. "Caching a prompt" sounds like the server keeps a copy of your text on file, ready to skip re-reading it later. That isn't what happens.
When the model processes a prompt, each token — at each of the model's attention layers — produces two vectors: a key and a value. Together they encode, roughly, "here is what this token means, and here is what to hand back if a later token attends to it." Computing those vectors for every token, at every layer, before the model writes a single word of output, is called the prefill pass — it happens in front of ("pre-") generation.
The complete set of those key and value vectors — across every layer, for every token in the prefix — is the KV cache. That set of numbers, not the words that produced it, is the thing prompt caching actually stores. Store the KV cache for a prefix once, and a later request that starts with the identical prefix can skip prefill for that whole stretch: load the stored vectors straight into the attention layers instead of recomputing them from scratch.
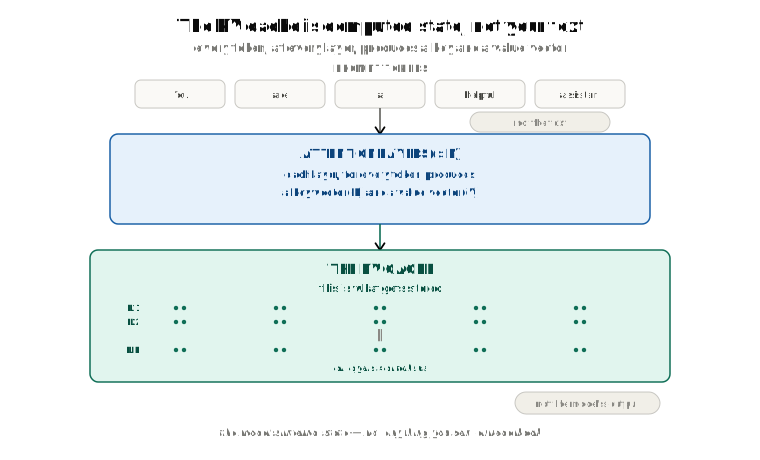
Two things follow immediately, and the rest of this post is mostly working them out in detail. First, since what's stored is the model's own numeric state rather than your bytes, that state only means anything to the exact model that produced it — a Sonnet KV cache is meaningless input to an Opus model. Second, since prefill is a deterministic function of the exact input, "the KV cache for this prefix" only makes sense if "this prefix" is defined exactly, byte for byte. Later sections lean on both.
What changes on a hit — and what doesn't
Say a stored KV cache for some prefix already exists, and a new request arrives whose prompt starts with that same prefix. What actually changes?
Nothing about what you send. The Claude API is stateless — there is no session and no server-side memory of your conversation — so you still send the complete payload, every field, every message, on every single call. A request that reuses a cache looks byte-for-byte identical, on the wire, to one that doesn't. The server compares the incoming bytes against what it has stored, and one of two things happens:
- A write — no matching prefix was found. The server runs the full prefill pass, computes the KV cache, and stores it for later.
- A read — a matching prefix was found, sometimes called a cache hit. The server skips prefill for that whole stretch and loads the stored keys and values straight into the attention layers.
Either way, the response that comes back looks like an ordinary response. Here's what a hit actually changes, and what it doesn't:
| Dimension | On a cache hit |
|---|---|
| Bytes you send | Unchanged — the full payload, every call |
| Server compute | Skipped, for the cached prefix |
| Billing | The cached prefix is billed at a steep discount instead of full price |
| Context window | Unchanged — cached tokens occupy exactly as much window as uncached ones |
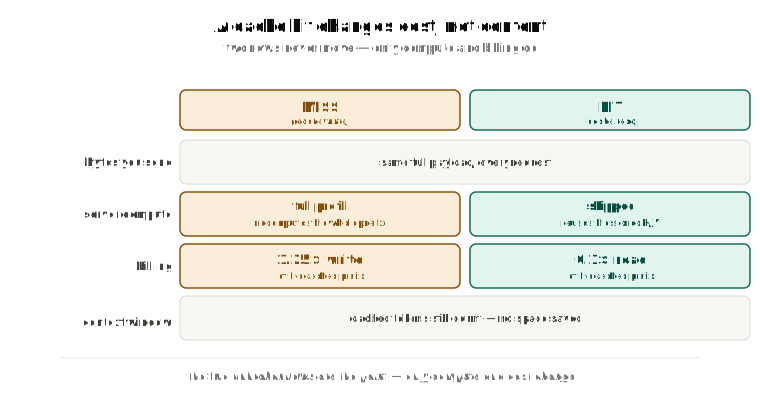
That last row is the one people get backwards. Caching changes what you pay and how fast the response starts. It does not change how much of the window your prompt occupies — a cached prefix still counts, token for token, against the model's context limit, exactly as What Fills Your Context Window, and Why Does the Answer Run Out of Room? covers.
A close analogy is a build cache in software. You still hand the compiler your entire source tree on every build — nothing about the command you type changes. The compiler just skips recompiling the files whose content hasn't changed since the last build. Same source, same command, faster build, lower bill for the machine time. Nobody calls that "the compiler forgetting some of your files." It isn't storing less of your project. It's doing less work on the part it already knows.
Why skipping the work saves money
Why does skipping work translate into a lower bill at all? Because on the input side, token price is basically compute-time price. Running prefill costs GPU time roughly proportional to how many tokens it processes; the per-token input price is that GPU time, amortized and marked up. A read skips prefill for the cached stretch, so some of that saved compute gets passed back to you as a discount.
Only some, though — a read is not free. On the Claude API a read costs about 0.1× the normal input rate (0.025× on Claude Fable 5.1). It isn't 0× because the server still has to hold your stored keys and values somewhere fast enough to serve on demand, and that storage costs real money too. You've traded a compute bill for a smaller storage-and-retrieval bill, not eliminated the bill entirely.
A write, by contrast, costs more than an ordinary uncached request: 1.25× the normal rate. A write does everything a normal request does — the full prefill pass — and then does one more thing on top: persist the resulting keys and values somewhere they can be found again later. That's strictly more work than a call that computes its result once and never keeps it, so it's priced accordingly.
The cache key is the bytes themselves
A read only happens when "a matching prefix was found." Matching how, exactly?
Byte for byte. Prompt caching is not fuzzy — it isn't looking for a prefix that means the same thing, or is close enough. It checks whether the incoming bytes, from the very first token up to the point you're asking about, are identical to some prefix it has stored. Change one character anywhere in that prefix — reorder a tool, edit a word in the system prompt, add a stray space — and the match fails from that position onward.
A bookmark makes the idea concrete. A bookmark left at page 40 of a book is only useful if pages 1 through 40 are still exactly what they were when you placed it. Insert a new paragraph on page 3 and every page after it shifts — the bookmark is still physically sitting between two pages, but it no longer marks where you left off.
What actually identifies a stored KV cache, then, isn't your API key, your account, or anything you name. It's a content hash: the server hashes the exact rendered bytes of the prefix, and that hash is the identity of one entry — this post's word for a single stored, reusable slice of KV cache, one row in the server's cache keyed by its hash. Two pipelines running under the same API key with different tools and a different system prompt hash to different values, so they land in different entries automatically. There's no configuration step to keep them apart, and the two cannot collide. If two entirely separate pipelines happened to render byte-identical prefixes on the same model, they would share the entry — that's a benefit, not a leak: identical bytes on the same model produce an identical KV cache no matter who asked for it.
This is exactly the idea behind content-addressed storage — the same principle behind a Docker layer cache. You never assign the name yourself; the content is the name.
Two scoping rules follow from treating the hash as identity. Entries are isolated between organizations — nothing about the hash lets one customer's cache be read by another customer's account. And the model is part of what gets hashed: a Sonnet 5 KV cache and an Opus 5 KV cache for the identical prompt text are two different entries, because the numbers a Sonnet layer produces for a token are meaningless as input to an Opus layer.
Setting a breakpoint
All of this — writes, reads, entries — happens automatically once you mark where a cacheable stretch of the prompt ends. That marker is a breakpoint: a cache_control field attached to one content block in your request.
{"type": "text", "text": "...", "cache_control": {"type": "ephemeral"}}
ephemeral names the only kind of cache entry the API currently makes: one with a time-to-live (TTL) — a countdown after which, if nothing reads it, the entry is discarded. Two TTLs exist, covered in full a few sections down; the default shown above is 5 minutes.
The model itself never sees this field. A breakpoint is plumbing the serving infrastructure reads before generation starts, not an instruction the model reasons about.
One more condition has to hold before any of this does anything: the prefix has to be at least as long as the model's minimum cacheable length, or cache_control silently does nothing — no error, no hit, no write.
| Models | Minimum |
|---|---|
| Claude Opus 5, Fable 5, Mythos 5, Fable 5.1, Mythos 5.1 | 512 tokens |
| Opus 4.8, Sonnet 5, Sonnet 4.6, Sonnet 4.5, Opus 4.1, Opus 4, Sonnet 4 | 1,024 tokens |
| Opus 4.6, Opus 4.5, Haiku 4.5 | 4,096 tokens |
That minimum is not monotonic across model generations — 512 tokens on the newest line, but 4,096 tokens on Opus 4.6, Opus 4.5, and Haiku 4.5. A 3,000-token prompt caches cleanly on Opus 5, Opus 4.8, and Sonnet 4.5, and silently doesn't on Opus 4.6 or Haiku 4.5, with nothing telling you so. These minimums hold on every platform the model is available on — there is no remaining per-platform exception.
The marker ends the span; it never starts one
Here's the detail that trips people up first: a breakpoint marks where a cached prefix ends, never where it begins. There's nothing to mark for "begins," because a prefix, by definition, always starts at the first token of the rendered prompt. So "set a breakpoint" really means one thing: pick a block, and say "the cached span runs from the start of the prompt up to and including this block."
Because render order is tools, then system, then messages, marking the last block of your system prompt automatically pulls the tool definitions into the cached span too — you never asked for that; it just falls out of where tools sit in the sequence.
Take a customer-support example: three tool definitions, a persona paragraph, then an escalation-policy paragraph carrying the breakpoint.
response = client.messages.create(
    model="claude-opus-5",
    max_tokens=1024,
    tools=[
        {"name": "lookup_order", "input_schema": {...}},
        {"name": "search_kb", "input_schema": {...}},
        {"name": "create_ticket", "input_schema": {...}},
    ],
    system=[
        {"type": "text", "text": PERSONA},
        {
            "type": "text",
            "text": ESCALATION_POLICIES,
            "cache_control": {"type": "ephemeral"},  # breakpoint here
        },
    ],
    messages=[
        {"role": "user", "content": f"Context:\n{chunks}\n\nQ: {question}"},
    ],
)
Here's what actually gets hashed and stored:
tools ──────────► system ──────────►│ messages
 lookup_order       PERSONA         │  chunks
 search_kb          ESCALATION_...  │  question
 create_ticket                   ▲  │
                             marker │
└──────── cached span ──────────┘   └── everything after: not cached
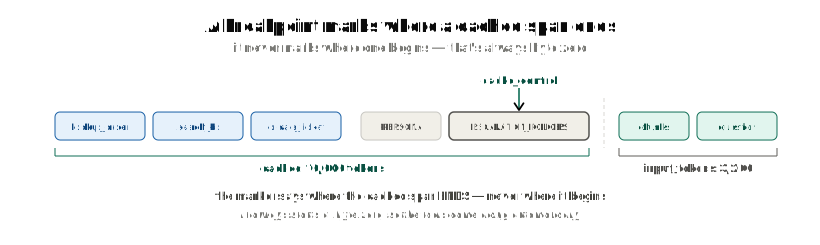
You never said "cache the tools." You said "the cached span ends here" — and the three tool definitions came along for free, because they render before the system prompt does.
Automatic caching, and when it backfires
Placing breakpoints by hand is the explicit form. There's also an automatic mode: put a single cache_control at the top level of the request instead of on a content block.
response = client.messages.create(
    model="claude-opus-5",
    max_tokens=1024,
    cache_control={"type": "ephemeral"},  # top level, not on a block
    system=[...],
    messages=[...],
)
The server places the breakpoint on the last cacheable block for you and moves it forward as the conversation grows — you never touch it again as new turns get appended. It's compatible with explicit breakpoints elsewhere in the request, but it consumes one of your four available breakpoint slots, so an automatic marker plus three explicit ones is the most you get. Two mistakes here return an HTTP 400 rather than failing quietly: setting all four slots with explicit markers and then adding the automatic one, and putting an explicit marker on the last block with a TTL that disagrees with the top-level field's.
Here's where it backfires. Automatic caching places the breakpoint at the end of the rendered prompt — the last block, whatever that happens to be. That's exactly right for a prompt that only grows by appending stable content. It's exactly wrong for a prompt that ends in content unique to this one request — retrieved chunks, a one-off question — because the breakpoint then lands after the unique tail. Every request pays the 1.25× write premium to store bytes nobody will ever ask for again. That's not a small inefficiency; it's a straight surcharge with no offsetting benefit, on every single call.
The signature to watch for: cache_creation_input_tokens shows a write on every request, while cache_read_input_tokens never once covers your whole shared prefix. If your logs look like that, automatic caching found the wrong end of the prompt to mark. The fix is the one from the worked example above — place an explicit breakpoint yourself, at the end of the part that's actually shared.
The combination that holds up best in an agentic loop is both at once: one explicit breakpoint pinned to the end of the static system prefix — tools plus system, which never changes — plus the automatic top-level marker left on to follow the growing, but still stable-at-the-start, conversation tail.
Nested, not sliced
Here's the most common misconception about multiple breakpoints: that each one caches its own separate section, the way slicing a loaf cuts it into pieces that sit side by side.
That's not how it works. Cache content is cumulative. Every breakpoint's entry contains everything from the first token up to that marker — including whatever an earlier breakpoint already covered.
Prompt:  [ Tools ][ System ][ Msg 1 ][ Msg 2 ][ Msg 3 ]
                  ▲          ▲                ▲
                 BP1        BP2              BP3

Entry 1: ├────────┤                          (tools)
Entry 2: ├───────────────────┤               (tools + system)
Entry 3: ├────────────────────────────────┤  (tools + system + msg 1 + msg 2)
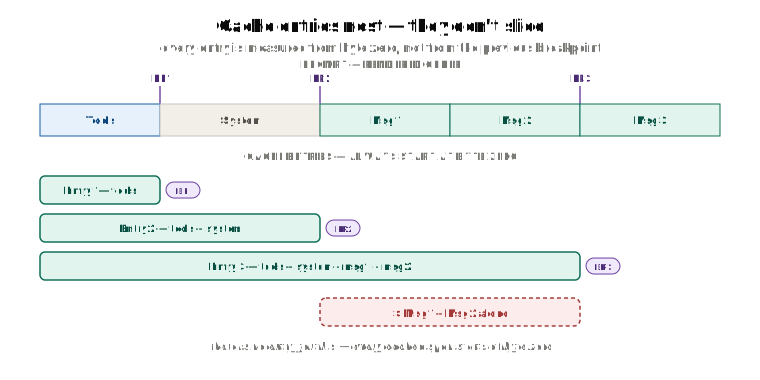
Read that as Russian dolls, not slices: entry 3 contains entry 2, which contains entry 1. There is no entry that holds only "Msg 1 and Msg 2" on their own — a cached span always starts at byte zero, so the only entries that can ever exist are ones that reach all the way back to the start of the prompt.
Which entry gets used
With entries nested inside each other, which one does a new request actually get served from? You don't choose — the server finds the longest previously cached prefix that ends at or before the point where your new request diverges from what's stored, and reads from there.
Take the three breakpoints from above, placed at realistic sizes:
BP1  after tools + system      → 10,000 tokens
BP2  after a chat summary      → 13,000 tokens
BP3  after the message history → 16,000 tokens
Three different follow-up requests, three different outcomes:
| Next request | Where it diverges from what's stored | Result |
|---|---|---|
| A plain follow-up question | After BP3 — nothing earlier changed | Reads BP3 → cache_read_input_tokens: 16000 |
| The conversation got re-summarized | At the summary, inside BP2's span | BP3 and BP2 both miss, but BP1 still hits → cache_read_input_tokens: 10000 |
| A seventh tool got added | Inside tools, which renders first | Everything misses — a full prefill on the whole prompt |
The middle row is the entire reason to place more than one breakpoint. Without BP1, re-summarizing the conversation would also cost a full re-prefill of the tool schemas and the system prompt — the two things in the request that hadn't actually changed. With BP1 sitting underneath BP2 and BP3, that stable base keeps paying off even after everything built on top of it goes stale.
Breakpoints themselves cost nothing — you only pay for tokens actually written or read, never for the marker. With up to four available per request, there's rarely a reason to place only one.
The 20-position lookback
There's one more condition on getting a read, and it has nothing to do with whether your bytes match. When the server looks for a previously stored entry matching your breakpoint, it doesn't search your entire history — it only looks back 20 positions from where your breakpoint sits.
A position, here, is not the same thing as a content block. Your messages array is a list of typed blocks — a chunk of text is a block, a tool call is a block, a tool result is a block — but a run of consecutive blocks of the same kind counts as a single position for this rule. A run of consecutive tool_use blocks is one position. A run of consecutive tool_result blocks is one position, no matter how many calls are inside it. So a turn where the model fires several tool calls in parallel and gets several results back in return adds two positions to the count, not one per call.
What does blow past the window is a long sequential run: many turns in a row, each adding its own text or tool exchange one after another, none of them collapsing into a shared run because they aren't adjacent blocks of the same kind. An agent loop that alternates a short model reply, one tool call, and its result — over and over, well beyond twenty times in a row — walks past 20 positions between the last stored entry and the newest breakpoint, and stops finding what it already paid to write.
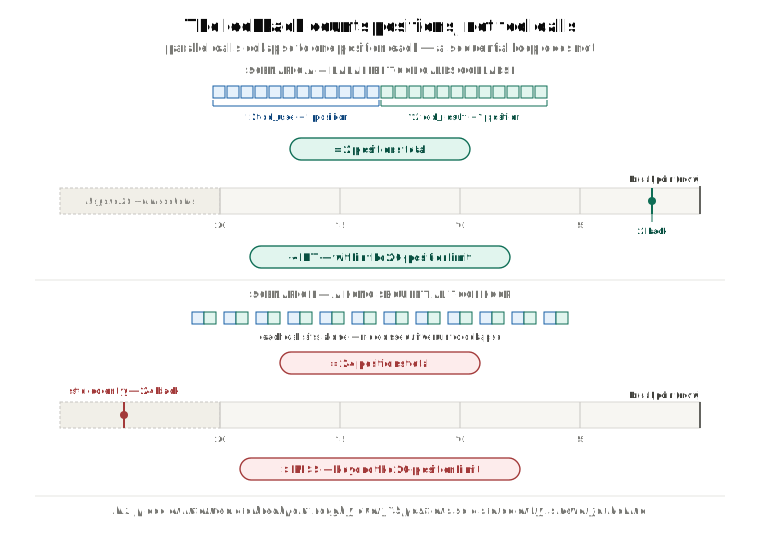
A librarian analogy makes the rule concrete. You left a bookmark in a book and asked a librarian to find it. The librarian only flips back 20 pages from wherever you're now pointing. If your bookmark is 35 pages back, it's still physically there — the librarian just never looks far enough to see it, and starts over as if nothing had ever been marked.
Nothing about your prompt has to change for this to bite. The prefix can be byte-identical to what you sent before; you've simply drifted more than 20 positions from where the entry was actually stored.
The fix takes the same shape in both cases: place an intermediate breakpoint roughly every 15 positions during a long turn, so a stored entry is never far behind wherever your next breakpoint lands. In practice this often takes the simpler form of a rolling marker — a cache_control on the last message, or the last two, on every request — so a fresh entry is always close by. Since breakpoints are free, marking two costs nothing extra and buys margin against a turn that appends more content than expected.
One more subtlety worth holding onto: the lookback only ever finds entries that an earlier request actually wrote at its own breakpoint. It doesn't discover stable content just because it happens to sit behind your current marker unread. So if your only breakpoint sits at the end of a system prompt whose last few lines are volatile — a timestamp, say — the span it marks includes those volatile bytes, and every single request misses and rewrites the whole thing. The marker has to sit between the stable part and the volatile tail, not after both.
TTL, and a clock that starts earlier than you think
Every ephemeral entry expires unless something reads it in time. There are exactly two lifetimes to choose from — no custom durations, no six-hour option:
{"cache_control": {"type": "ephemeral"}}                 # 5 minutes, the default
{"cache_control": {"type": "ephemeral", "ttl": "1h"}}     # 1 hour
A read is a hit: it writes nothing new, costs the discounted read rate, and — this is the detail worth remembering — resets the entry's expiry clock, at no extra cost. Adding cache_control to a request never forces a fresh write; a write only ever happens on a genuine miss.
Walk a timeline on the 5-minute default:
t = 0:00   request 1 → MISS.  Writes the entry.  Expires ≈ 5:00.
t = 3:00   request 2 → HIT.   Reads it.  Expires ≈ 8:00 — clock reset, free.
t = 6:00   request 3 → HIT.   Expires ≈ 11:00.
t = 25:00  request 4 → MISS (the last hit was at 6:00; nothing arrived before 11:00).
                        Writes a fresh entry.
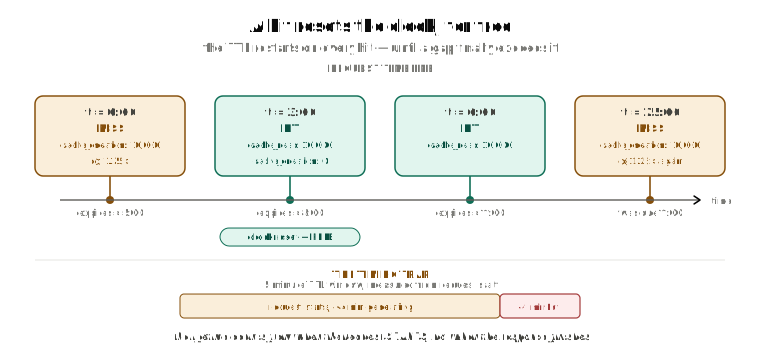
So the 1.25× write premium is paid once, and every request after it — as long as no single gap between requests exceeds the TTL — pays only the discounted read rate. A steadily used chatbot can keep one entry alive indefinitely on the 5-minute setting, refreshed on every turn.
The trap: the clock starts at the beginning of the request that writes or reads the entry, not at the moment its response finishes. Generation time counts against the TTL exactly like idle time does. A response that takes 4 minutes to stream out leaves only about 1 minute for the next request sharing that prefix to arrive before a 5-minute entry expires. A long agentic turn can burn most of its own TTL just producing output, even though nothing looks idle from the outside.
One rule governs mixing the two TTLs in a single request: entries with the longer TTL must appear earlier in the prefix than entries with the shorter one. In practice that's the order you'd want anyway — your most stable content (tools, system prompt) furthest forward on the 1-hour TTL, with a faster-changing tail behind it on the 5-minute default.
Reading the usage fields
Every response carries a usage object, and its input count splits into three buckets that never overlap:
total input = input_tokens
            + cache_creation_input_tokens
            + cache_read_input_tokens
| Field | Meaning |
|---|---|
cache_creation_input_tokens | Tokens written to a new entry this request — a miss, billed at the write rate |
cache_read_input_tokens | Tokens served from an existing entry this request — a hit, billed at the read rate |
input_tokens | Everything else: not written, not read, processed at full price |
That last one trips up almost everyone at least once: input_tokens is the leftover, not the total. It's the tail of the prompt sitting after the last breakpoint that had anything to write or read — usually the part that's different on every request, like retrieved chunks or the newest message. Read input_tokens as your whole prompt size and you'll badly undercount, sometimes by an order of magnitude.
Two more fields fill in details the three-way split leaves out. usage.cache_creation breaks a write down by which TTL it used: ephemeral_5m_input_tokens and ephemeral_1h_input_tokens. And if your request uses a server-side tool like web search, expect an extra 5-minute write to appear right after the tool results, at a position you never marked yourself — that's the server inserting its own cache point after tool output, and it's expected behavior, not a sign that something invalidated your cache.
What it actually costs
The multipliers
| Write multiplier | Read multiplier | |
|---|---|---|
| 5-minute TTL | 1.25× | 0.1× |
| 1-hour TTL | 2× | 0.1× (0.025× on Claude Fable 5.1) |
Reads cost the same regardless of which TTL wrote the entry. The longer TTL isn't "better caching" in any sense — it buys a longer window before an idle gap forces a rewrite, at double the write price. Think of it as an insurance premium against traffic that arrives less often than every five minutes, not an upgrade to the caching itself.
Break-even
Per token of a cached prefix, over N requests that all read the same entry:
No caching:  N × 1.0
Cache, 5m:   1.25 + 0.1 × (N − 1)
Cache, 1h:   2.0  + 0.1 × (N − 1)
With the 5-minute TTL, two requests already break even: one write plus one read costs 1.25× + 0.1× = 1.35×, against 2× for two uncached calls. With the 1-hour TTL you need at least three requests: one write plus two reads costs 2× + 0.2× = 2.2×, against 3× uncached. Below those counts, caching costs more than doing nothing; at or above them, it's strictly cheaper, and it keeps getting cheaper with every additional read.
A worked example
Take a customer-support RAG bot, similar in shape to the breakpoint example from earlier:
System prompt (persona, escalation policy) + 6 tool definitions
  — identical on every request                             10,000 tokens
Retrieved knowledge-base chunks — different every query      3,000 tokens
The user's message                                              200 tokens
                                                            ──────────────
Total input                                                 13,200 tokens
The breakpoint sits at the end of the 10,000-token static block. The numbers below are illustrative — worked by hand to show the shape of a real bill, not pulled from a live call — but the arithmetic is exactly what a real usage object looks like for a prompt built this way.
Turn 1, nothing cached yet:
{
  "cache_creation_input_tokens": 10000,
  "cache_read_input_tokens": 0,
  "input_tokens": 3200,
  "output_tokens": 450
}
Turn 2, same static prefix, a new question and new chunks:
{
  "cache_creation_input_tokens": 0,
  "cache_read_input_tokens": 10000,
  "input_tokens": 3750,
  "output_tokens": 380
}
Watch the shape across turns, not just the numbers: cache_read_input_tokens stays pinned at 10,000, while input_tokens creeps up as chat history accumulates. That's the healthy pattern to look for in a real log.
Only 10,000 of the 13,200 total tokens ever get cached, and that's deliberate, not a limitation. The chunks and the user's message are different on every single call — caching them would mean paying the 1.25× write premium on bytes you already know you'll never read back. You cache what repeats across requests, and you leave what varies outside the breakpoint on purpose.
Run this out over 100 turns, at the base input rate of 1.0 per token:
No caching:   100 × 10,000 × 1.0                        = 1,000,000 units
With caching:   1 × 10,000 × 1.25   (one write)          =    12,500
               99 × 10,000 × 0.10   (99 reads)           =    99,000
                                                            ──────────
                                                              111,500 units
That's roughly 89% off the cost of the static prefix alone, on top of every request after the first starting to generate sooner because prefill was skipped. As a bonus, cache reads mostly don't count against a model's input-token rate limit on the Claude API, so a cache-heavy workload also gets more effective throughput out of the same rate-limit tier.
Should you cache everything? No.
Caching isn't free to attempt, and the write surcharge means turning it on for the wrong workload costs more than leaving it off. Three conditions all have to hold before it's worth it:
- The prefix is longer than the model's minimum, covered above — below it,
cache_controlsilently does nothing. - The prefix is byte-stable across the requests you're hoping will share it.
- It gets read back at least twice before a 5-minute entry expires, or at least three times before a 1-hour one does — the break-even counts from the section above.
| Use it for | Why |
|---|---|
| Agentic tool loops | Same prefix read many times within a minute — the best return on the write |
| Q&A over one fixed document | The document itself is the stable prefix |
| Long-system-prompt chat | Prefix only grows, and it's read on every turn |
| Batch jobs sharing a prefix | Use the 1-hour TTL — batches often run past 5 minutes between calls |
| Skip it for | Why |
|---|---|
| One-shot, unique-prompt calls | Every call is a write that's never read — pure loss |
| Short prompts | Below the model's minimum, it silently does nothing |
| Sporadic traffic | Gaps consistently longer than the TTL mean every call is a fresh write |
| Prompts still being edited | Every edit orphans the entry the previous edit just paid to write |
Choosing between the two TTLs comes down to your median gap between requests that share a prefix: under about 4 minutes, the 5-minute default keeps refreshing for free and never needs the 1-hour premium; between 4 minutes and an hour, paying 2× once beats paying 1.25× repeatedly; past an hour, consistently, don't cache that path at all.
The empirical test cuts through all of the above: instrument a day of real traffic and compare cache_read_input_tokens against cache_creation_input_tokens. Reads should dominate writes by a wide margin. If they're roughly equal, caching is currently costing you money, not saving it.
Two things that look like caching failures and aren't
Two behaviors look, from the outside, like something is broken. Neither is.
Pre-warming with max_tokens: 0. Send a request with max_tokens set to zero, and the server still runs prefill and writes the cache entry at your breakpoint — it just returns immediately afterward, with content: [], stop_reason: "max_tokens", and a populated usage block showing the write. Zero output tokens get billed; you pay the normal write charge and nothing for generation. This is a legitimate way to warm an entry ahead of traffic you can predict. It's not worth doing when traffic is already continuous enough to keep the entry warm on its own — a separate warm-up call there is just one more write you didn't need — when the prefix is too small to cache in the first place, or when you'd be speculatively warming many different prefixes that mostly won't get read, since each one is a 1.25× write that can cost more than the latency it saves.
The parallel-request race. A cache entry only becomes readable once the first response sharing its prefix has begun streaming back. Fire off several identical requests at the same moment — a common pattern in fan-out or multi-agent designs — and every one of them is still mid-prefill while the others start, so none of them can read what the others are still in the middle of writing. All of them pay full write price. The same arithmetic holds at any fan-out width: N parallel workers reading the same context each write their own entry and read none of the others'. If a design routes many workers over one shared static prefix, staggering the first request slightly, or funneling that first call through a single warm-up request before fanning out, is what actually gets the fan-out reading from cache instead of each one paying to write it.
What kills your cache
The ordering rule
Since render order is always tools, then system, then messages, and any byte change at position N invalidates every breakpoint at or after N, one rule follows directly: front-load everything stable, and put everything volatile at the very end.
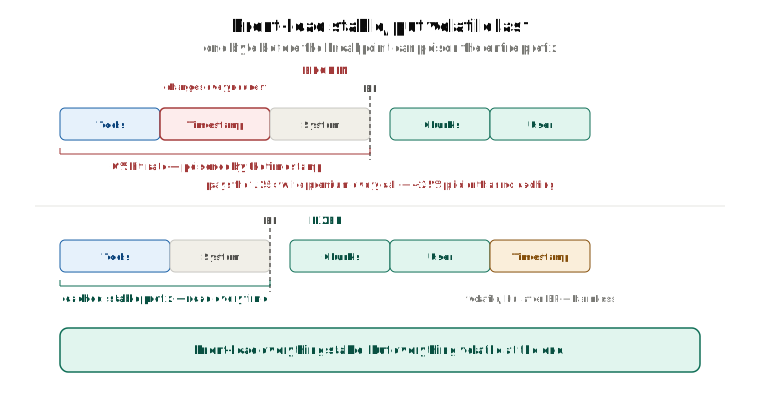
The classic version of this bug is a single line: Current date: {datetime.now()} sitting at the top of a 12,000-token system prompt. A handful of bytes change on every request, near the very front — so every breakpoint downstream of it misses, on every single call, forever. cache_read_input_tokens sits at zero and nothing in the response tells you why.
The RAG-specific version of the same mistake is placing retrieved chunks before the system prompt. It feels natural — chunks are "context," and context feels like it belongs up front. But the chunks are different on every query by design, so putting them ahead of the stable system prompt poisons everything behind them. Chunks belong after the breakpoint, not before it.
The modern fix for the timestamp version of this bug doesn't require touching the system prompt at all. Instead of editing the top-level system field, append a message with role: "system" directly into the messages array:
messages.append({
    "role": "system",
    "content": "Current date: 2026-09-09",
})
This carries operator authority — the same standing as your top-level system prompt — without touching the bytes the cache is keyed on. It's available today, with no beta header, on Claude Opus 5, Opus 4.8, Fable 5, Fable 5.1, Mythos 5, and Mythos 5.1 — but not on Claude Sonnet 5, which returns a 400 (role 'system' is not supported on this model) if you try. Placement follows two rules: this message must follow a user message (or an assistant message that ended in a server-tool call), and it must either be the last entry in messages or be immediately followed by an assistant turn — it can never be messages[0].
Three tiers, not one
It's tempting to think of "the cache" as one thing that either survives a change or doesn't. It's actually three tiers, layered the same way render order is layered — tools, then system, then messages — and a change only ever invalidates its own tier and the tiers behind it, never the ones in front.
Read each row as answering one question: does this tier still survive the change on the left?
| Change | Tools cache | System cache | Messages cache |
|---|---|---|---|
| Tool definitions (add / remove / reorder) | ❌ | ❌ | ❌ |
| Model switch | ❌ | ❌ | ❌ |
speed, web-search, citations toggle | ✅ | ❌ | ❌ |
| System prompt content | ✅ | ❌ | ❌ |
tool_choice, images | ✅ | ✅ | ❌ |
thinking or effort change | model-specific | model-specific | ❌ |
| Message content | ✅ | ✅ | ❌ |
Two rows are worth calling out because it's easy to over-assume from them. Changing tool_choice per request, or adding and removing images across turns, does not touch the tools-plus-system cache — only the messages tier goes. And ordinary message content never touches the tools-plus-system cache at all, which is the entire reason caching survives a normal back-and-forth chat.
Only two things force a full rebuild of every tier, on every model: changing the tool definitions themselves, and switching models mid-conversation. Everything else in the table costs you at most the messages tier.
Thinking mode and effort deserve their own note. Changing either always invalidates the messages cache, and on models that render the thinking configuration ahead of tools and system in the sequence, it takes those tiers with it too. The safe habit is to pin both per route — one fixed setting per endpoint or agent role — rather than varying them request to request. Setting a model's own default value explicitly costs nothing at all; it behaves identically to omitting the field, so there's no reason not to pin it.
The escape hatches
For the changes that do invalidate a tier, there's usually a cache-preserving alternative — but availability differs per row, and none of these four are gated together as a bundle:
| Change that normally invalidates | Cache-preserving form | Available on |
|---|---|---|
| Tool definitions (add / remove) | tool_addition / tool_removal blocks | Opus 5 onward, beta mid-conversation-tool-changes-2026-07-01 |
| System prompt content | A {"role": "system", ...} message appended to messages[] | Opus 5, Opus 4.8, Fable 5, Fable 5.1, Mythos 5, Mythos 5.1 — available today, no beta header |
| A per-turn reminder you want removed later | A turn-scoped system message with clear_at: "next_user_message", left visible in the transcript | Same six models, beta mid-conversation-system-clear-at-2026-08-21 |
effort change | {"role": "system", "content": [], "output_config": {"effort": ...}} | Fable 5.1, Mythos 5.1, Opus 5, beta mid-conversation-output-config-2026-07-01 |
Model switch has no row here, deliberately — there is no escape hatch for it. Cache entries are scoped to the model that wrote them, full stop, so switching models mid-task always forfeits every cache you'd built up. That's the hidden cost of a cost-saving cascade that routes cheap steps to a smaller model and expensive steps to a larger one: every hop between models is also a hop between caches. Keeping one model on the main loop, and spawning a subagent call for a cheaper sub-task instead of switching the loop's own model, avoids paying that cost repeatedly.
The silent invalidator list
Most cache breakage doesn't come from a deliberate change like the ones above — it comes from something in the prompt-assembly code that quietly isn't as stable as it looks. This is the list worth grepping your own codebase for:
| Pattern | Why it breaks caching |
|---|---|
datetime.now() / Date.now() / time.time() in the system prompt | The prefix changes on every single request |
uuid4() / crypto.randomUUID() / a request ID rendered early in the prompt | Every request becomes unique by construction |
json.dumps(d) without sort_keys=True, or iterating a set | Serialization order isn't guaranteed stable |
| An f-string interpolating a session or user ID into the system prompt | The prefix becomes per-user, so it can never be shared |
A conditional system section (if flag: system += ...) | Every combination of flags is its own distinct prefix |
tools=build_tools(user) where the tool set varies by user | Tools render first, so this invalidates everything behind it too |
One more source doesn't show up in a grep at all: forks. Summarization, server-side compaction, and sub-agent calls all build a new request from a parent conversation, and if that new request rebuilds system, tools, or model with even one difference from the parent's — a different key order, a slightly different string — it misses the parent's cache entirely and starts over. The fix is mechanical: copy those three fields from the parent verbatim, and only append fork-specific content after them.
Debugging a cache that isn't hitting
Cache diagnostics is a beta feature for exactly this — instead of bisecting your prompt by hand, ask the server where it diverged. Call it through the beta namespace, with the beta enabled:
response = client.beta.messages.create(
    model="claude-opus-5",
    max_tokens=1024,
    betas=["cache-diagnosis-2026-04-07"],
    diagnostics={"previous_message_id": None},  # None on the first turn
    system=[...],
    messages=[...],
)
On every turn after the first, pass the previous response's ID instead of None. The result comes back on response.diagnostics, showing exactly where this request's prefix diverged from the one before it.
That's for when you already suspect a problem. The more valuable habit is catching it before anyone notices: log all three usage fields — input_tokens, cache_creation_input_tokens, cache_read_input_tokens — on every call, and alert when the ratio of reads to writes drops.
This failure mode is worth taking seriously precisely because it's silent. Nothing errors. Nothing warns. The request succeeds, the response is correct, and the only symptom is a bill that's quietly higher than it should be. And it's usually a regression, not a bad first implementation — caching worked when it was written and verified, then some later, unrelated change to how the prompt gets assembled broke byte-stability, and nothing announced it. Months can pass before the pattern shows up in a cost dashboard.
The standing check worth keeping in a test suite: send the same request twice and assert that the second response shows cache_read_input_tokens > 0. That one assertion catches the whole silent-regression class before it ships, instead of after a month of the wrong bill.
Every provider has this — they just disagree about who drives
Prompt caching isn't an Anthropic invention, and it isn't unique to the Claude API. Every major provider caches parts of a prompt to avoid redundant compute. What differs between them is the mechanism — specifically, whether you're the one placing the marker, and therefore whether a lookback window like the one above even applies to you.
Unverified below. Everything in this section about OpenAI, Gemini, and Bedrock comes from the author's working notes, not from the reference this post is otherwise verified against. None of it was checked against live provider documentation in this session — last checked 2026-09-09. Provider prices, minimums, and TTLs change often; treat every number below as a starting point to re-verify, not as a fact to build a cost model on.
| Anthropic (Claude API) | OpenAI — unverified | Gemini — unverified | |
|---|---|---|---|
| Who decides what gets cached | You — explicit breakpoints, chosen TTL | The provider, automatically, reportedly on prompts over ~1,024 tokens | Both — automatic implicit caching, plus explicit named caches you create and reference |
| Breakpoints | Up to 4 explicit, plus one automatic slot | None | N/A — you create and name a cache object instead |
| Lookback window | 20 positions | N/A | N/A |
| Minimum cacheable prefix | 512 / 1,024 / 4,096 tokens, model-dependent (see above) | Reportedly ~1,024 tokens | Reportedly ~1,024 tokens (Flash) / ~4,096 tokens (Pro) |
| Write cost | 1.25× (5-minute TTL) / 2× (1-hour TTL) | Reportedly free | Reportedly billed as storage, per hour, on explicit caches |
| Read cost | 0.1× (0.025× on Claude Fable 5.1) | Reportedly ~90% off | Reportedly ~90% off |
| TTL | Exactly 5 minutes or 1 hour | Reportedly not configurable | Reportedly configurable |
The consequential difference isn't the lookback number — it's who eats the write cost. On the unverified figures above, OpenAI's reported zero write cost means there's no decision to make and no way to lose money on it; it just happens in the background. Anthropic's surcharged write buys control — you choose where the breakpoint sits and which TTL applies — at the price of having to think about placement. Gemini's explicit caches reportedly bill by storage time instead of by token, a genuinely different unit of accounting to reason about.
Same models, different platform, different numbers — worth calling out on its own:
| Anthropic first-party | AWS Bedrock — unverified | |
|---|---|---|
| Minimum cacheable prefix | 512 / 1,024 / 4,096 tokens, model-dependent — no per-platform exception remains | Reportedly 1,024 tokens per breakpoint |
| Default TTL | 5 minutes | Reportedly 30 minutes, via prompt_cache_options.ttl |
| Write cost | 1.25× (5-minute) / 2× (1-hour) | Reportedly 1.25× |
| Read discount | 0.1× (0.025× on Fable 5.1) | Reportedly ~90% |
Worth flagging the tension in that first row directly: the verified minimum-prefix table earlier in this post states plainly that the old per-platform exception was removed, and that no per-platform exception remains for minimums on any model. Whether Bedrock's default TTL differs from first-party Anthropic's is a separate question from the minimum, and it stays unverified here either way — treat the 30-minute figure as unconfirmed until checked against live Bedrock documentation.
The one thing that survives all of this and transfers to every provider, verified or not: byte-exact prefix stability is what decides your hit rate, everywhere. Static content first, volatile content last, no timestamps or request IDs anywhere near the front of the prompt. That habit pays off identically on Claude, on GPT, and on Gemini. The only difference is whether you're the one who gets to say where the stable part ends.
Recap
- What's cached is the model's already-computed internal state — the KV cache of key and value vectors from the prefill pass — never your text and never the output.
- A hit changes compute and billing. It never changes what you send, and it never shrinks how much of the context window your prompt occupies.
- The cache key is a content hash of the exact rendered bytes up to a breakpoint — a marker that always ends a span starting at position zero, never a region whose start you choose.
- Multiple breakpoints nest, they don't slice: the longest previously cached prefix ending at or before your divergence point is the one you get, which is why placing more than one pays for itself.
- The lookback that finds a stored entry only reaches back 20 positions — a run of parallel tool calls collapses to one position, but a long sequential loop can walk past the window and force a rewrite.
- TTL is 5 minutes or 1 hour, exactly. A read resets the clock for free, but the clock starts at the beginning of the request, not the end — a slow generation eats into its own TTL.
- Writes cost 1.25× (5-minute) or 2× (1-hour); reads cost about 0.1× (0.025× on Fable 5.1). Two reads already break even on the shorter TTL; three on the longer one.
- What actually kills a cache is almost always ordering — volatile content sitting ahead of a breakpoint — or a wrong assumption about which tier survives a given change; tool-definition changes and model switches are the only two that force a full rebuild everywhere.
- The failure is silent: no error, no warning, just a higher bill. The only reliable defense is logging all three usage fields and asserting, in a test, that a repeated request actually reads from cache.
Prompt caching never stores your text and never shrinks your context window — it stores the model's already-computed state for a byte-exact prefix, and it only pays off once that exact prefix gets read back before its clock runs out.